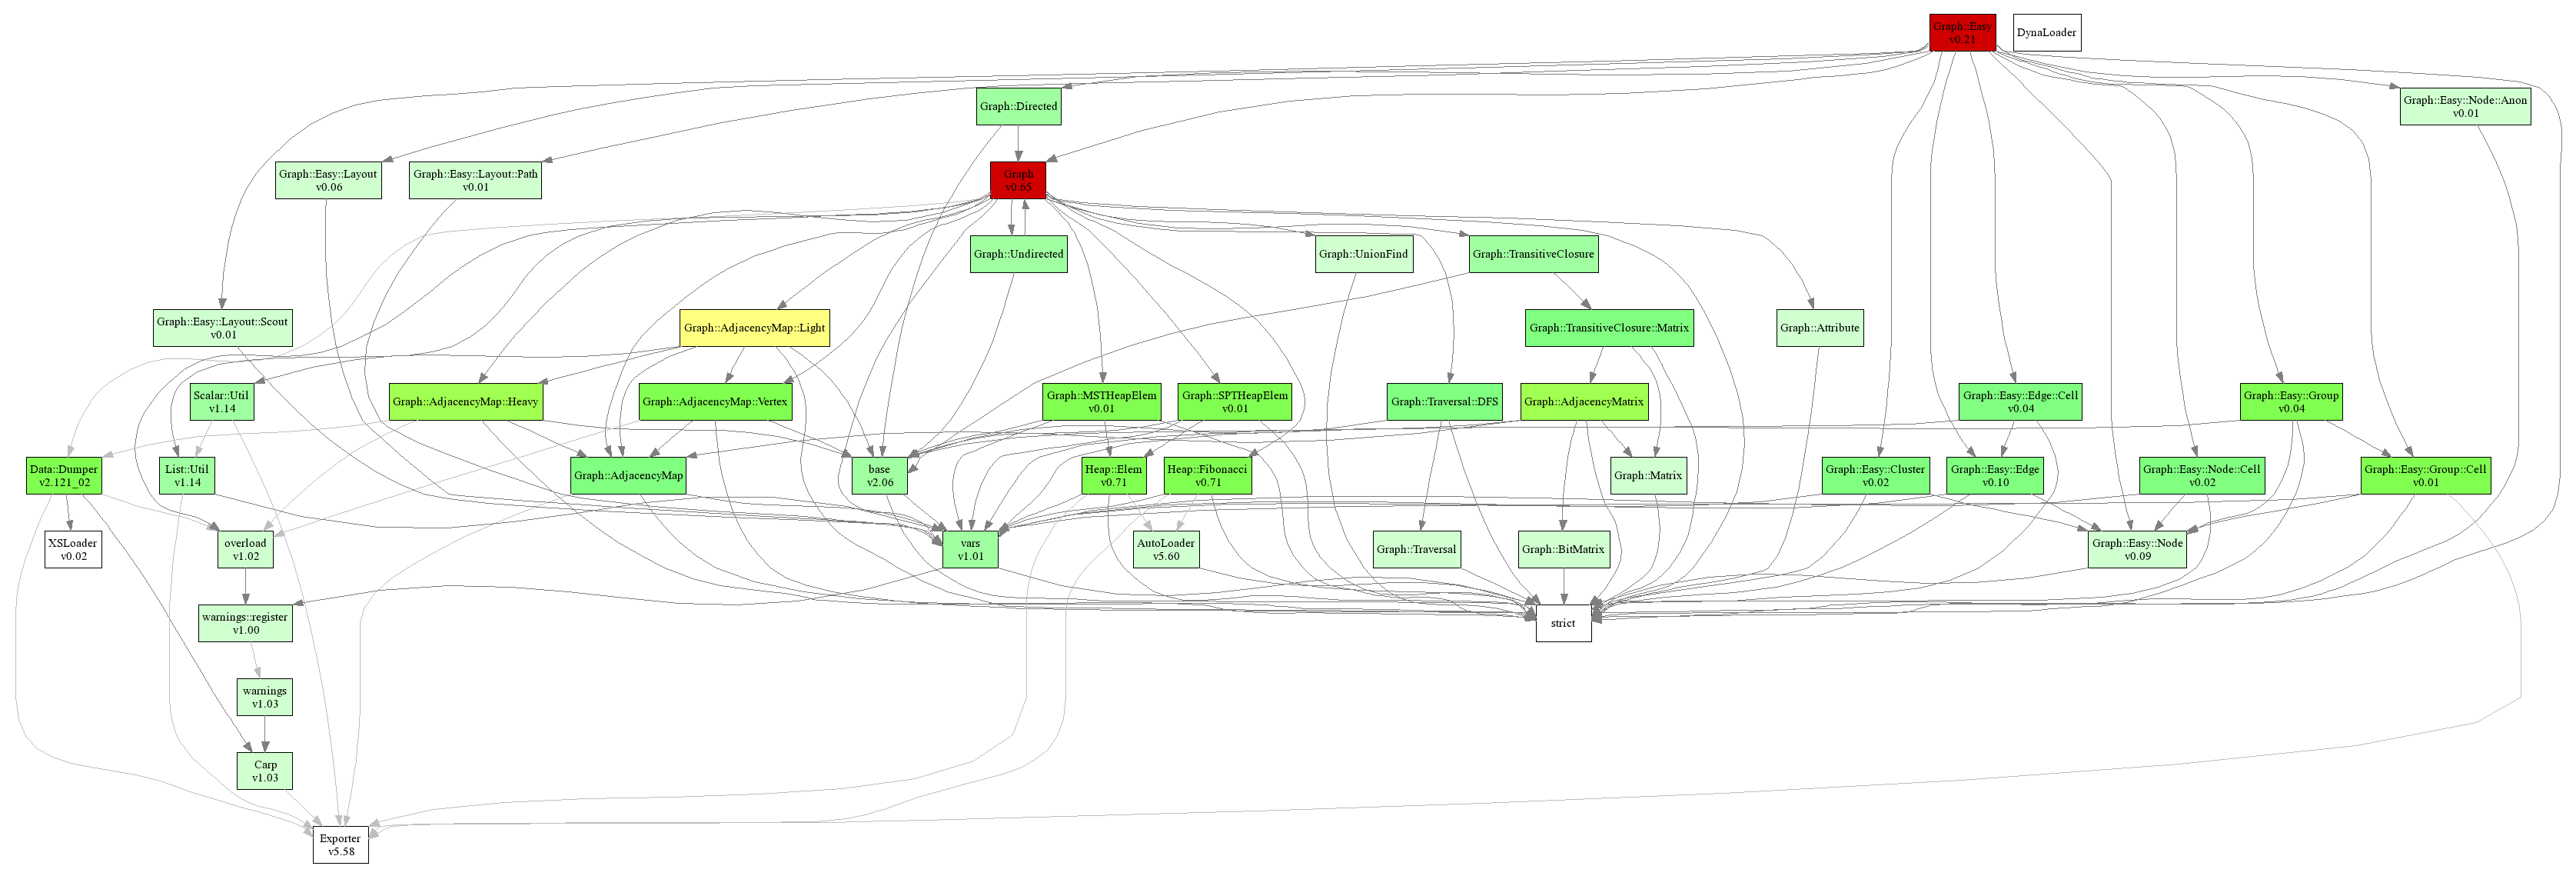
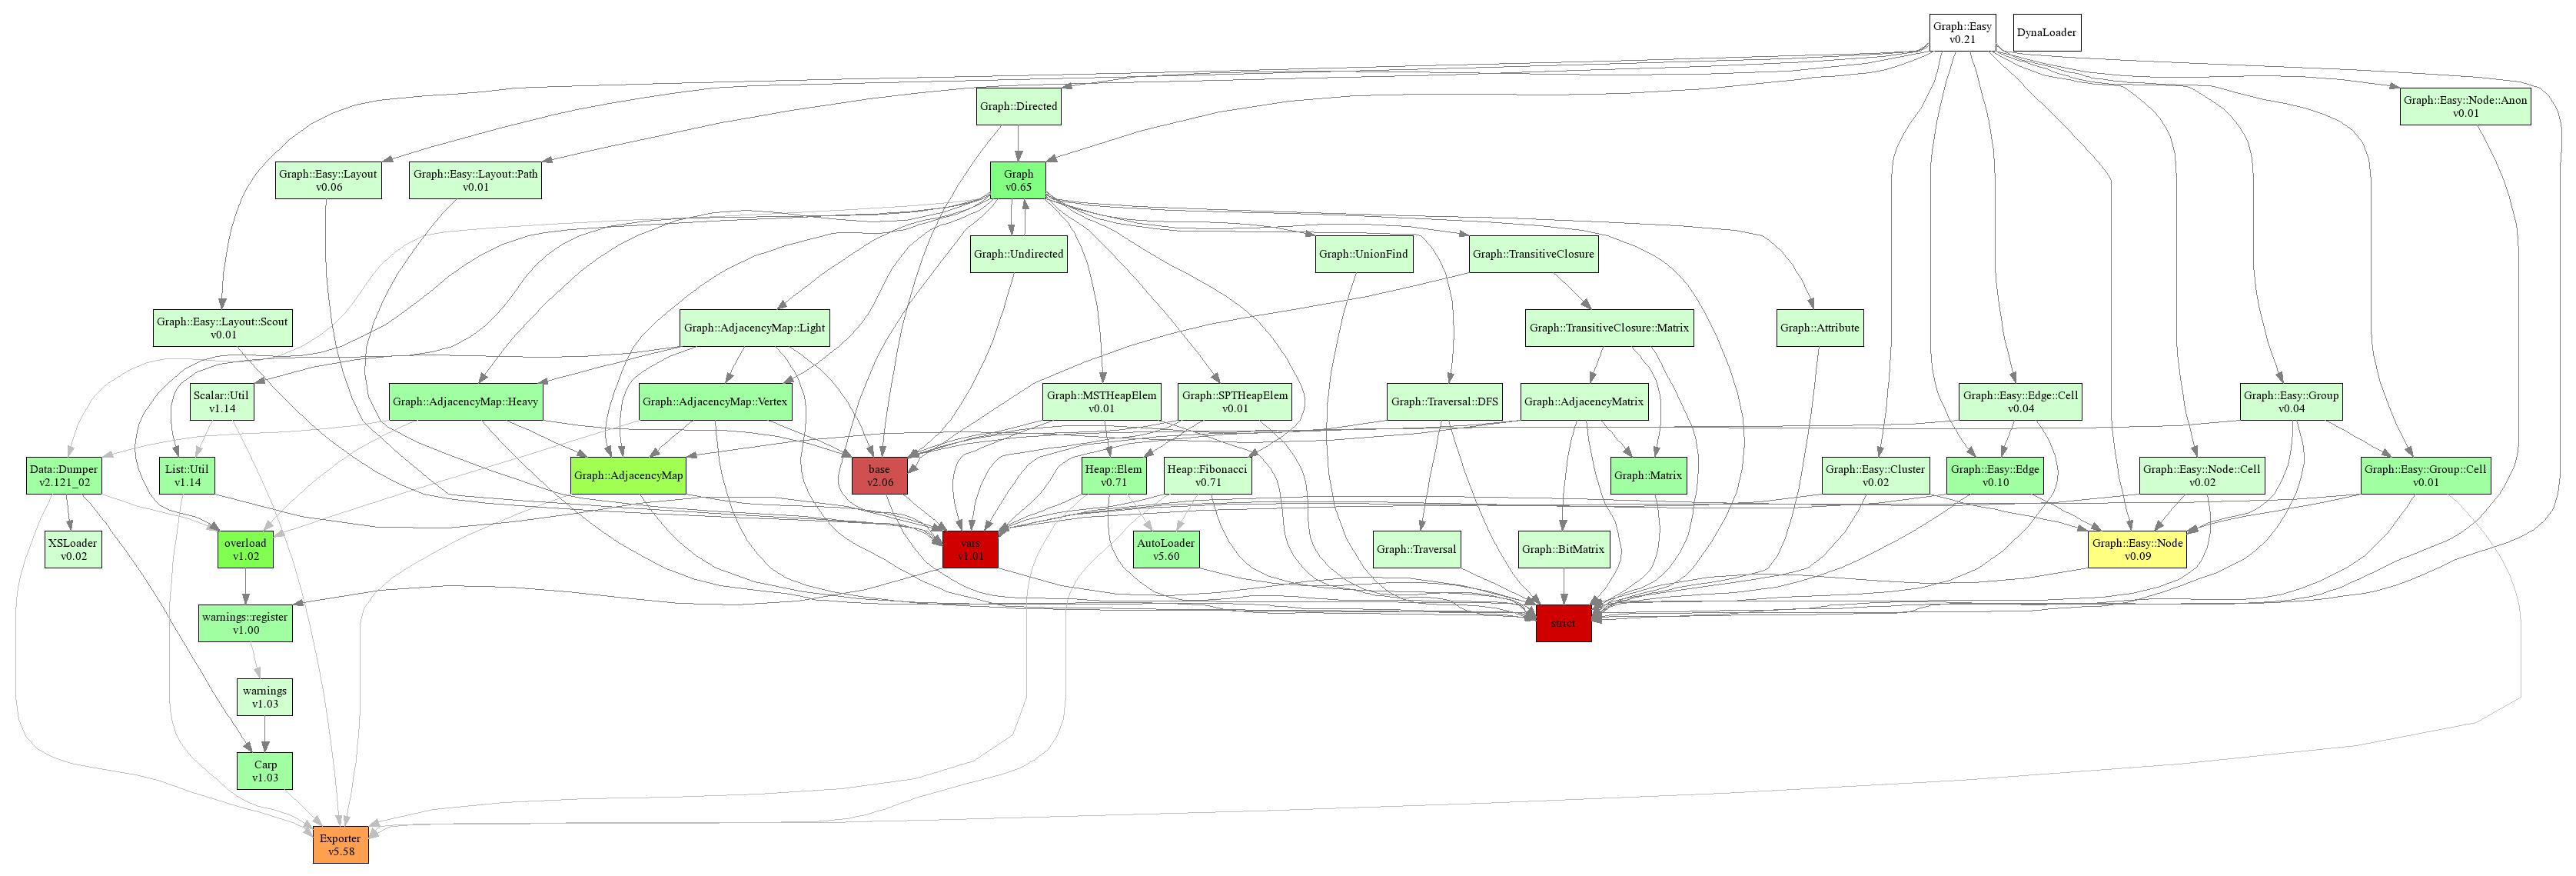
A few words to the colors:
- Darker edges mean
use, lighter edgesrequire - Color mode 1 was used, meaning the nodes progress from white over pale green to green, yellow, orange to red depending on how many other packages they load.
vars
Here are two versions of graphs generated for the vars package, both recursively.
Blead:
 v5.8.6:

v5.8.6:
Note that the two resulting images cannot be scaled and do not have mouse-over titles for individual nodes.
Here is one of them as HTML and ASCII, output by Graph::Easy. Note mouse-over the nodes gives you the
amount of packages used, and you can zoom the graph by using text-zoom (CTRL and +/- with Mozilla):
| vars v1.01 |
------> | strict | |||||||||||||
| | | v |
|||||||||||||||
| warnings::register v1.00 |
------> | warnings v1.03 |
------> | Carp v1.03 |
------> | Exporter v5.58 |
|||||||||
Here is the same graph, as ASCII:
+--------------------+     +----------+
| vars               | --> | strict   |
| v1.01              |     +----------+
+--------------------+
  |
  |
  v
+--------------------+     +----------+     +-------+     +----------+
| warnings::register | --> | warnings | --> | Carp  | --> | Exporter |
| v1.00              |     | v1.03    |     | v1.03 |     | v5.58    |
+--------------------+     +----------+     +-------+     +----------+