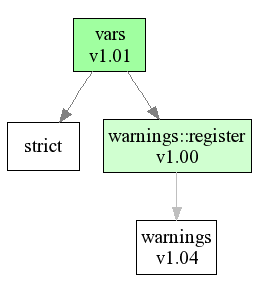
Example output:

This project aims at graphing the usage tree of Perl packages. This is slightly
different as dependency-trees
in that it tracks which packages are actually use'd and require'd
by a specific class.
Thus it enables you to find out what packages will be actually loaded when you do a
use Package;.
Look at the examples page to see some example outputs.
Modes of Operation: Recursing vs. Traversing
gen_graph has two modes. The default is traverse: If you throw
it a file or source code path, then it will parse this file, or all .pm files found in the path
and create a graph from them. If you do not specify the --inc option,
then gen_graph will use @INC e.g. the installed Perl packages.
Yes, this means you can feed it the entire Perl source like this:
./gen_graph --inc=/usr/src/blead/lib
Be warned, though, the resulting usage.png file will be huge!
The other mode is called recurse and switched on by using the
--recurse=Package::Name option. It works good with no --inc
option (using the installed Perl packages), but you can also use a different Perl source
tree:
./gen_graph --inc=/usr/src/blead/lib --recurse=vars

./gen_graph --recurse=vars
The first example uses the blead Perl source tree, the second one the installed version.
recurse mode is very usefull for feeding it your own package and see what it will
all pull in - often enough third party packages load a lot of stuff that you didn't
expect.
Limitations
There are currently three limitating factors:
- Graph::Easy - this makes HTML and ASCII output only feasable for small to medium sized graphs
- dot - the creation of huge graphs as PNG and SVG is possible (unlike with Graph::Easy),
but dot doesn't do a good job in creating a usable/readable graph. The resulting graphic
is huge, and unreadable/unmanagable and the lines cross so much that it is very confusing.
- The code parses the package files and figures out VERSIONS (if
--versions is
used) and use and require statements by some dirty hacks. This means it will occasionally
get things wrong. If you notice something faulty, please report it as bug!
Read more
details
about the current limitations in the Graph::Easy package and how I want to overcome them.
You will need the following packages and programs:
- Graph::Easy (at least v0.50)
- dot/graphviz (to get .png output, and for complex graphs)
- Graph-Usage (at least v0.12)
You can get all these (except dot) from search.cpan.org.
Graph::Easy and Graph-Usage are also available from my
server.
graph usage v0.07 (c) by Tels bloodgate.com 2005.


Usage:
            ./gen_graph --inc=lib/ --format=graphviz --output=usage_graph
            ./gen_graph --nocolor --inc=lib --format=ascii
            ./gen_graph --recurse=Graph::Easy
            ./gen_graph --recurse=Graph::Easy --format=graphviz --ext=svg
            ./gen_graph --recurse=var --format=graphviz --ext=jpg
            ./gen_graph --recurse=Math::BigInt --skip='^[a-z]+\z'

    Options:

            --color=X               0: uncolored output
                                    1: default, colorize nodes on how much packages they use
                                    2: colorize nodes on how much packages use them
            --nocolor               Sets color to 0 (like --color=0, no color at all)

            --inc=path[,path2,..]   Path to source tree or a single file
                                    if not specified, @INC from Perl will be used
            --recurse=p[,p2,..]     recursively track all packages from package "p"
            --skip=regexp           Skip packages that match the given regexp. Example:
                                      -skip='^[a-z]+\z'             skip all pragmas
                                      -skip='^Math::BigInt\z'       skip only Math::BigInt
                                      -skip='^Math'                 skip all Math packages

            --output                Base-name of the output file, default "usage".
            --format                The output format, default "graphviz", valid are:
                                      ascii (via Graph::Easy)
                                      html (via Graph::Easy)
                                      svg (via Graph:Easy)
                                      dot (via Graph:Easy)
                                      graphviz (see --generator below)
            --generator             Feed the graphviz output to this program, default "dot".
                                    It must be installed and in your path.
            --extension             Extension of the output file. For "graphviz" it will
                                    change the format of the output to produce the appr.
                                    file type.  For all other formats it will merely set
                                    the filename extension. It defaults to:
                                      Format        Extension
                                      ascii         txt
                                      html          html
                                      svg           svg
                                      dot           dot
                                      graphviz      png
            --flow                  The output flows into this direction. Default "south".
                                    Possible are:
                                      north
                                      west
                                      east
                                      south
            --versions              include package version number in graph nodes.

            --debug                 print some timing and statistics info.

    Help and version:

            --help                  print this help and exit
            --version               print version and exi
If you have questions, feel free to send me an email
(Gnupg key).
Bugreports should go to rt.cpan.org.
